Primary purpose of the survey
World Vision Mozambique’s overall strategic goal is to make a significant and measurable contribution to the well-being of 3.7 million vulnerable girls and boys by 2020 by implementing five technical programmes in the areas of Maternal, Newborn, and Child Health and Nutrition, Education, Child Protection, Food Security and Economic Development and Water, Sanitation and Hygiene. The purpose of this baseline survey was to collect and analyse data to track progress towards this goal.
The specific objectives were to:
- Assess the current status of outcome indicators and set realistic targets
- Understand current context to inform programme implementation
- Validate strategic direction and inform investment
- Strengthen monitoring and evaluation systems
- Enhance technical programme staff competency on conducting baseline surveys
Survey design
The baseline survey used a mixed-method approach, quantitative and qualitative. The quantitative portion was designed to calculate representative population estimates and detect statistical differences between proportions and means from baseline to endline for agreed levels of precision at the national and district levels. Three quantitative tools were developed:
- Caregiver Survey (CGS): World Visions’s standard household survey tool
- Youth Healthy Behaviour Survey (YHBS): Targets children 12-18 years old
- School-based Test About Reading (STAR): World Vision’s standard literacy tool
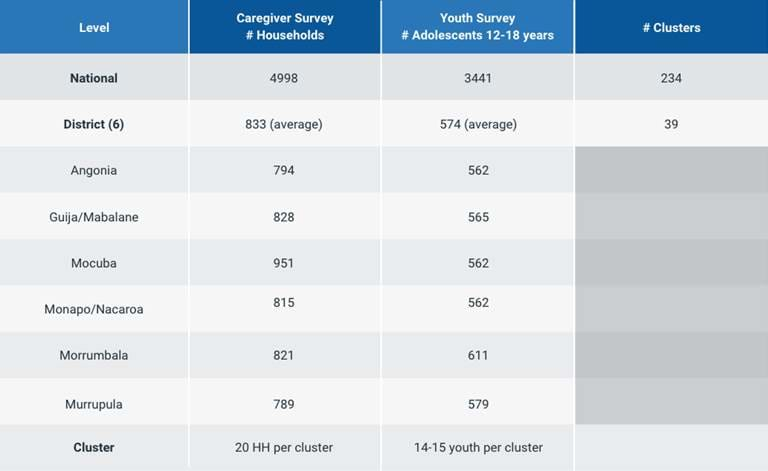
The household and youth surveys used a two-stage stratified, cluster sampling design with probability proportional to size used to sample the clusters or villages while the segmentation method was used to select individuals or households. World Vision districts were the strata.
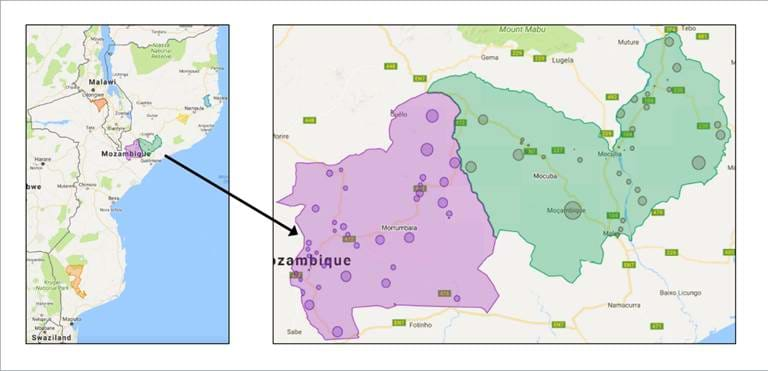
The survey covered the following districts: Angonia, Guija, Mabalane, Mocuba, Monapo, Nacaroa, Morrumbala, Murrupula. Some districts were combined for the survey to match programme administration areas for a total of 6 World Vision districts. Each district had 39 clusters, and an average of 833 households and 574 adolescents selected for interviews in each cluster.
Tools and protocols used to implement the survey
There were several issues in developing a cluster / primary sampling unit (PSU) sampling frame for the household and youth surveys as the currently available census data was 10 years old and only has detail up to the localidade level, which on average had over 2,000 households or 11,000 people, well over a recommended size of 100 households per PSU. World Vision Mozambique had neither time nor budget to complete a household listing.
The World Vision team used WorldPop 2017 UN-adjusted estimates to account for changes in the population distribution over the last decade, and used the GridSample R algorithm to generate 44 clusters of 480 people each per the six strata. A map shapefile of World Vision Mozambique districts was created using the software QGIS based on the Posto Administrativos (PAs) or geographic administrative level-3 boundaries where World Vision works (original shapefiles from GADM). TThe coverage of PAs by World Vision programmes is not uniform with most programmes covering entire PAs while some do not. To make up for this misalignment, 5 extra clusters were created and sampled per district, which replaced, through random selection, clusters outside of World Vision focus areas or where no households were found. The shapefile of clusters were opened in Google maps to display their exact location over satellite images.
In order to randomly select households within each cluster, the modified segment design was used. Each cluster was subdivided into five smaller segments, which is equal to the number of households (~100) in the cluster divided by the desired cluster size (20) and rounded to the nearest whole number. Satellite maps of the cluster were used to create the segments. Dwellings were counted and divided into five segments with roughly equal number of dwellings in each segment. Existing boundaries such as roads and rivers were used where possible. After segmentation, one segment was randomly selected within each sampled cluster. All the households contained within the boundaries of the sample segment are then interviewed for the survey, even if above or below 20.
The national office staff worked with district staff to review clusters and complete segmentation on the google maps. Some printed on large paper to facilitate while others were comfortable online. Once final, the map of the segmented cluster was printed and given to fieldworkers.
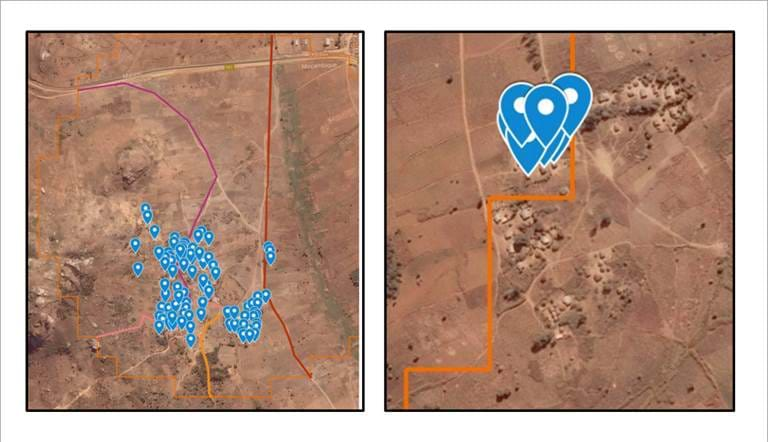
Figures: Google map showing the cluster boundary and selected households
Fieldwork experience
In this specific scenario, cost and time were significantly lower than the alternative. The alternative would have been a full household listing across several districts to create the sampling frame. Instead, we were able to spend a couple days familiarising ourselves with R and GridSample, working through some errors/bugs and then creating the field maps. This did take 1-1.5 weeks but was only 1-2 people rather than a full survey team and had some lag time waiting for programme to run.
The final maps were very easy to view digitally in detail and print large-scale for field teams. Satellite images were very clear and accurate making it easy to use “natural” boundaries such as rivers and roads to guide household sampling where street names and addresses were absent.

